What’s New for the month of June 2025
We’re always working to improve our software based on real feedback from clients, system integrators, and field teams. This section highlights the latest enhancements made across our platforms — including Trakzee and SmartWaste . From improved reporting tools and live tracking features to smarter job planning and better citizen engagement, each update is designed to make day-to-day operations more efficient, flexible, and user-friendly.
Explore what’s new below — and see how these changes can bring more value to your team and clients.
1 Trakzee Updates
1.1 Reports now support multiple geofence groups
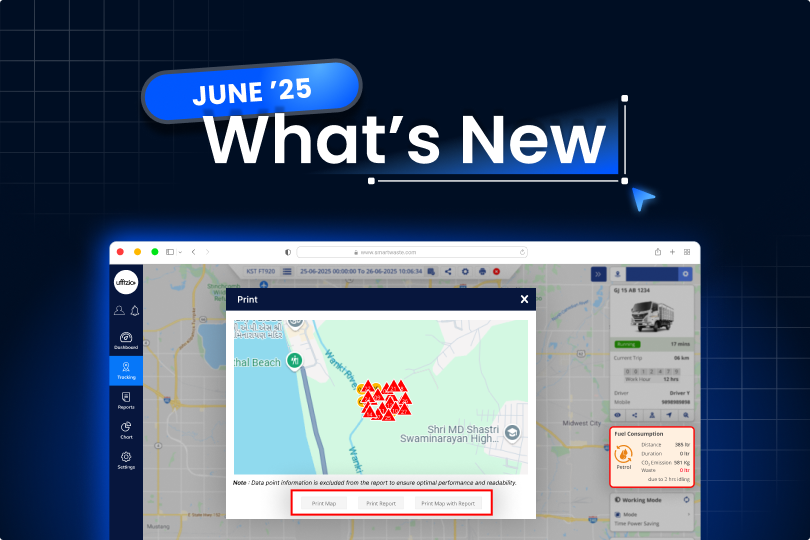
We’ve made it simpler to use geofence filters in your reports. You can now select multiple geofence groups at once when checking:
- Fence inside travel report

- Fence outside travel report
- Geofence trip report
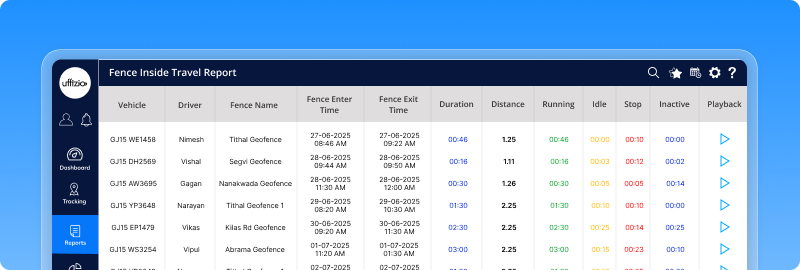
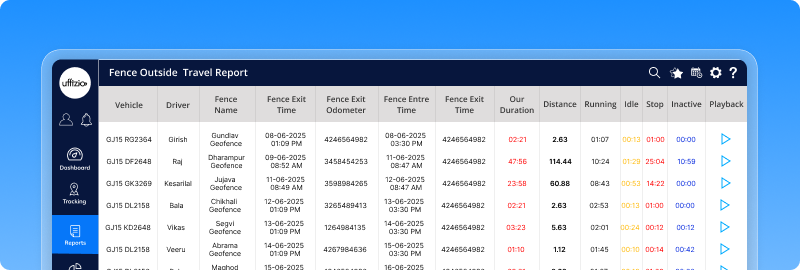
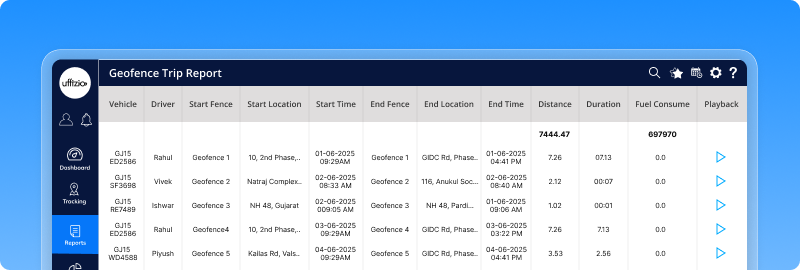
Once you pick a group, the list of geofences will automatically appear, no need to search manually. This update was driven by user feedback to simplify geofence-based analysis across multiple zones.
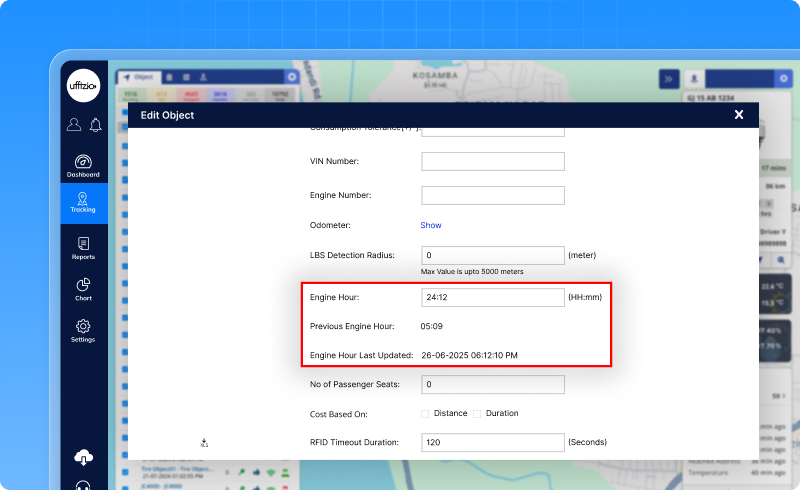
1.2 Engine hour calculation made easier
Keeping track of engine hours is now as simple as checking the odometer. We’ve added a new update that auto-calculates engine hours whenever new data is updated. Just like with odometer readings, users can now view calculated engine hours instantly with a simple “Show” button.
- Instant engine hour calculation on demand
- Editable field to enter or adjust engine hours in HH:MM format
- Displays the previous value and the last updated time
This update was introduced to fix an earlier issue and to make engine hour management smoother for your clients, especially those tracking equipment runtime or vehicle usage over time.
1.3 Fuel data is now split day by day
We’ve upgraded the fuel web service API to give daily-level insights instead of just total values over a selected period. Your clients can now clearly see how much fuel was used, how far the vehicle travelled, how long the engine ran, and when refuelling happened, for each individual day. No more digging through aggregated data.
What’s improved:
- API responses now support day-wise data grouping
- Every day in the selected range shows its own detailed entry
- Format stays in JSON, ensuring a smooth transition for current users
This enhancement helps resellers and system integrators offer more detailed performance tracking to clients, especially valuable for fleets that monitor daily usage and efficiency.
1.4 Now track all recharges in one simple report
Ever wondered how many devices were recharged last week? Or which reseller or company did it? We’ve added a new recharge Summary Report that gives you a clear picture of every top-up done, whether it was done manually or online.
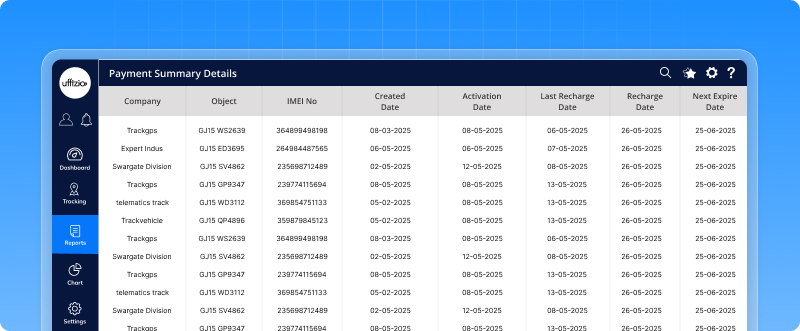
Here’s what you can do now:
- See who recharged what — by admin, reseller, or company
- Check total amounts, taxes, and object counts in one view
- Drill down into details like recharge dates, activation info, and expiry
- Switch between a quick summary and full details
- Export the report easily in Excel, PDF, or CSV
- Even schedule it to auto-send to your inbox
This new report helps you stay in control of recharge activities across all levels, so nothing slips through the cracks.
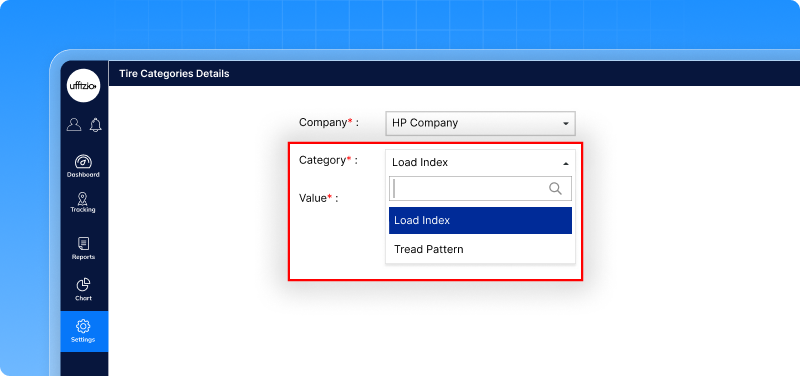
1.5 Smarter tire data entry with new dropdowns and fields
We’ve updated the tire entry process to help your clients track tire performance more accurately. Now, instead of typing values manually, users can select Tread Pattern and Load Index from a dropdown, ensuring cleaner and consistent data. We’ve also added Ply Rating to capture more tire details.
These inputs will now be uniform across all entries, which means better comparisons for mileage, cost, and project-level performance.
1.6 Object group filter now in live tracking
Managing large fleets on the go just got easier. We’ve added a new Object Group filter in the Trakzee Mobile App. Now, when using Live Tracking or sharing a location, users can filter vehicles based on predefined groups — like “Delivery Vans,” “Construction Units,” or any custom category set by the company.
It’s simple: Just pick the company, choose an object group, and view only the vehicles that matter. This helps users focus on specific fleets, save time, and share more relevant location data, especially useful for teams managing multiple clients or divisions.
![]()
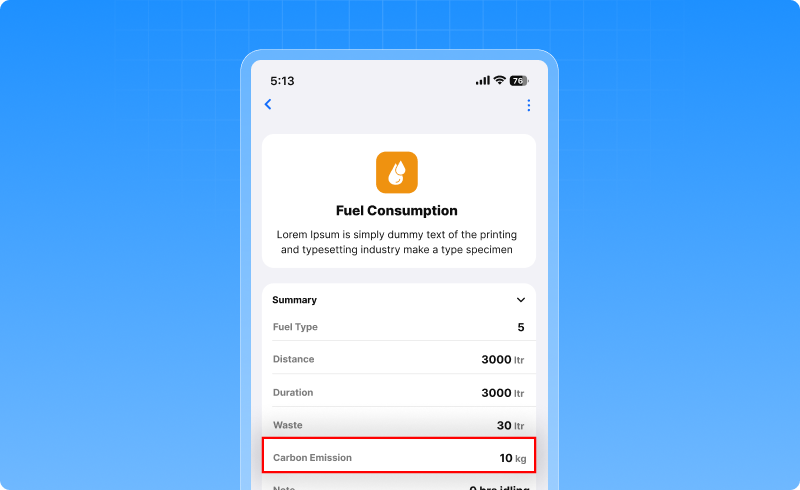
1.7 Track carbon emissions along with fuel use
We’ve added a small but powerful update to the fuel consumption widget: It now shows how much CO₂ your vehicles are emitting. As your clients track fuel usage, they’ll also see the amount of carbon released, shown clearly in kilograms. It’s all calculated automatically based on fuel type and consumption.
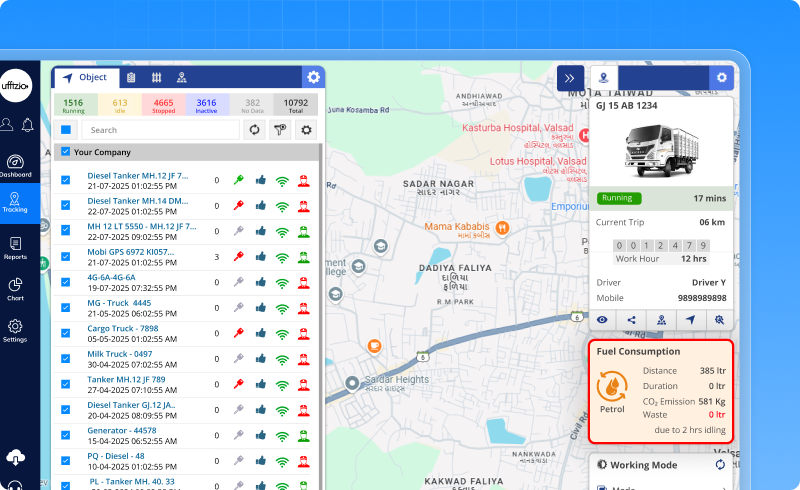
- It helps companies see their environmental impact
- It encourages fuel-saving habits like reducing idling
- It supports sustainability goals and compliance.
This update is now live on both the web and mobile app, giving users an easy way to connect fuel use with carbon emissions.
1.8 Fuel fill & drain events now available via API
We’ve built a new API to make fuel fill and drain data easily accessible, especially for those who want to show this information on their own client websites or platforms. Instead of pulling data from full reports, this new web service lets the system directly fetch fuel fill and drain events for any vehicle within a selected time range.
How it helps:
- Faster chart loading with cleaner data
- Works using either plate number or IMEI
- Returns time-stamped fuel levels for accurate chart plotting
- Supports better integration and flexibility for system partners
This enhancement makes it easier for integrators to build responsive tools and give users a smoother fuel tracking experience.
1.9 Elock reports now with lock type details
Until now, the elock violation report only showed that a security event happened, but not which lock triggered it. With this update, your clients can now:
- See whether it was the main lock or a sub-lock that caused the issue.
- Track new event types like valve abnormal, anti-disassembly, and motor abnormal.
- View a summary that breaks down violations by lock type.
- Check all this on both the web and mobile app, with better reports and easier exports.
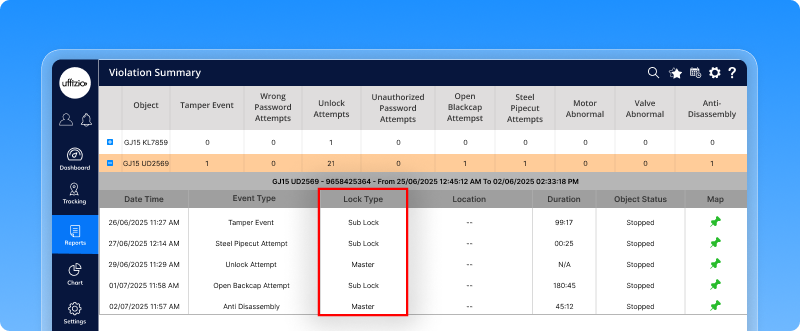
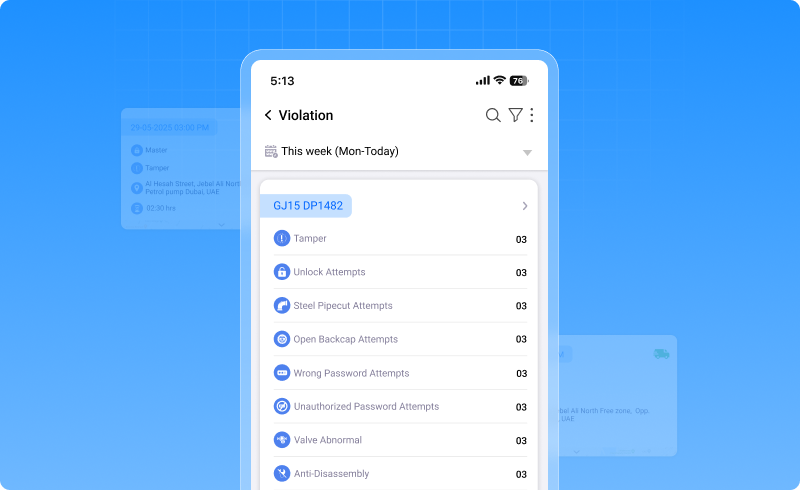
This makes it much easier to find the exact cause of a security breach and take the right action quickly. This update is now live on both the web and mobile app
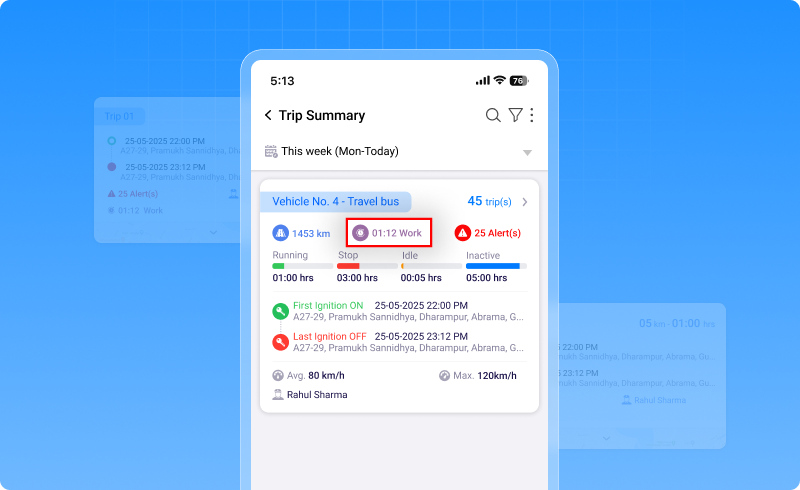
1.10 See total work duration in trip reports
We’ve made it easier to see how long a vehicle was actually working during a trip. A new column called “Work Duration” has been added to the Trip Summary and Trip Detail reports. It shows the total time a vehicle was running or idling, which means it was active and doing some kind of work.
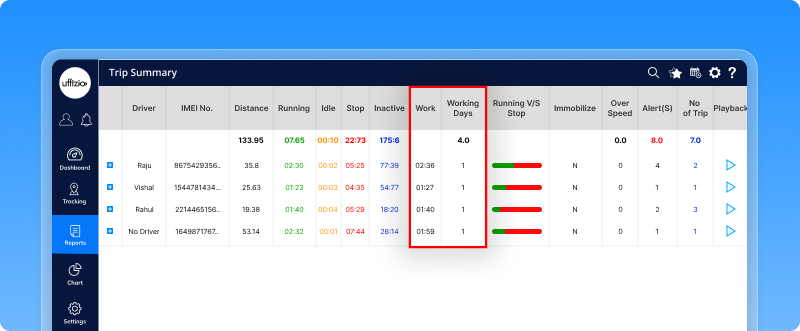
What’s improved:
- You can now see how much time each trip was active
- Available on both web and mobile reports
- Included in downloads and scheduled reports
This helps fleet managers quickly understand which vehicles are being used well and which ones are not.
1.11 QR code tracking for site entry compliance
We’ve added a new feature to help your clients comply with GPS tracking rules. Now, vehicles can have a QR code placed on them, which allows on-site security to scan and instantly:
- Check if the GPS tracker is active
- See the vehicle’s live location
- View the route taken on the same day
How it works:
- Each vehicle gets a unique QR code, downloadable in PDF or JPG
- Security scans the code and enters a company-assigned PIN
- They get access to tracking data for a limited time (default: 10 minutes)
- No need to log in or call anyone
![]()
This feature gives system integrators a simple way to support clients working on improving transparency, security, and compliance without extra effort.
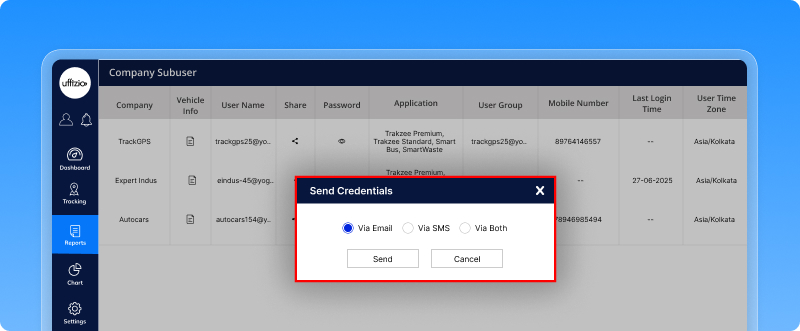
1.12 Send credentials via SMS/Email from overview screen
Sometimes users forget their login info, and until now, it was only sent once when the account was created. With this new update, you can now resend login details (username and password) to any user anytime.
Here’s how it helps:
- Just click the “Send Credentials” option next to a user’s name
- Choose to send by SMS, Email, or both
- The system will check if SMS or Email is set up, and let you know if it’s not
- The message will include the user’s username, password, and login link
It’s a quick and easy way to help users log in again, without any manual work or support calls.
1.13 Improved export for long-duration playback reports
We’ve made an important improvement to the Playback screen’s export feature to avoid issues when exporting reports for longer time periods.
What’s new:
- When you export data for more than 2 days, the system will now skip the detailed data points to keep the PDF clean, readable, and fast to generate
- If the duration is 2 days or less, all detailed data (timestamps, speed, location, etc.) will still be included
- A note will pop up explaining this when you export long-duration reports
- The PDF will also now have a proper filename based on vehicle plate number and date
- Temperature graph and header issues have been fixed for better formatting
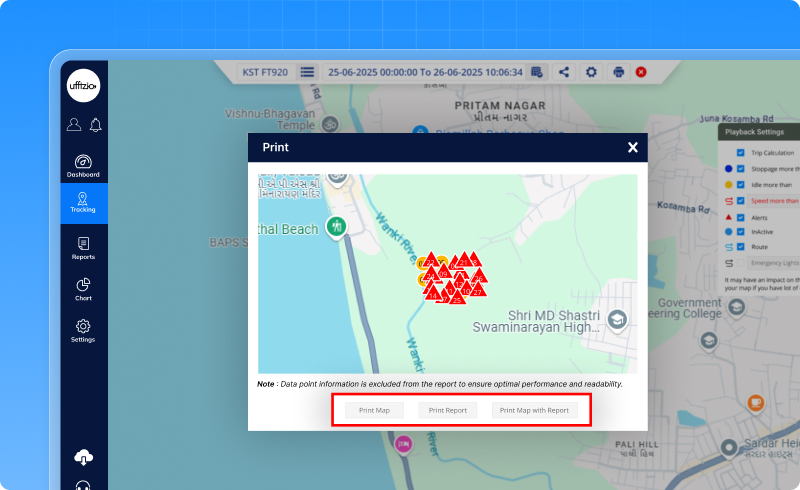
This update helps your clients avoid slow downloads, broken layouts, and heavy files, while still getting the data that matters.
2. Smartwaste Updates
2.1 Easier job setup with town-level collection rules
Until now, your clients had to set the tolerance time (how late a visit can be) separately for every address in a town. That took time, and often led to mistakes.Now, with the new Collection Address Rule, they can set just one rule that applies to all addresses in the town.
Here’s how it works:
- Add a rule with a start date and tolerance time (in minutes)
- It will automatically apply to all collection addresses in that town
- It replaces the individual settings, so everything stays consistent
- If they remove the rule, the system goes back to the old setup
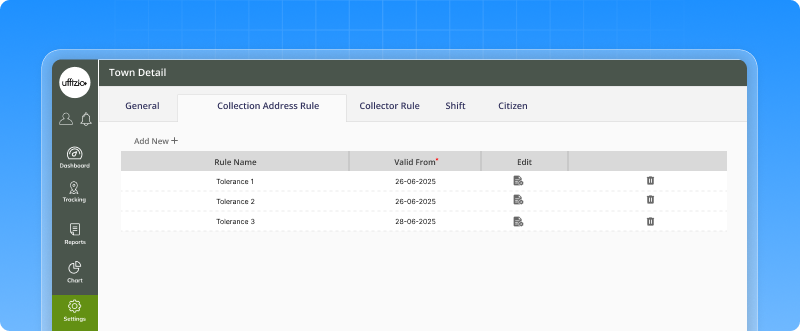
This makes it much easier and faster to set up jobs, especially for towns with many bins or collection points.
2.2 Delete multiple jobs at once with bulk delete
Earlier, if your client needed to clean up old or unused jobs, they had to delete them one by one, which was slow and frustrating. Now, that’s changed. We’ve added a Bulk Delete option to the Job Overview screen. With just a few clicks, users can:
- Select multiple jobs at once
- Filter by Company, Branch, Town, Zone, or Ward to narrow down the list
- Use “Select All” to pick everything in one go
- Delete all selected jobs in one action

A confirmation popup ensures no job is deleted by mistake. And if any selected jobs are active or in progress, the system will alert the user before proceeding. This update saves time, reduces manual work, and makes data cleanup and management much easier, especially for large teams handling high job volumes.
2.3 Auto-calculate reach time in job planning
Planning collection jobs just got a lot easier. Earlier, users had to manually enter the estimated time a vehicle would reach each address. That often led to mistakes or inconsistent planning. Now, SmartWaste will auto-calculate the Estimated Reach Time for every collection point, based on the job’s Estimated Start and End time.
How it helps:
- Saves time by auto-filling reach times for each address
- Ensures even and accurate time distribution across all points
- Still allows manual edits if needed
- Keeps job planning fast, clean, and consistent
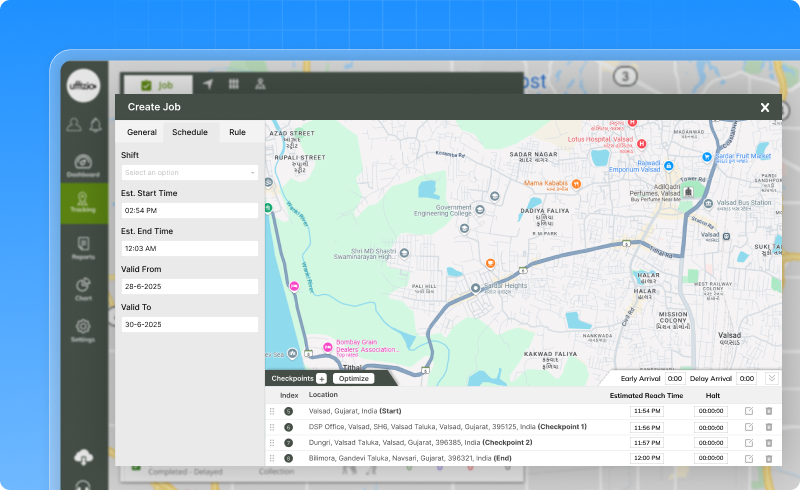
This update brings the same smart logic used in Trakzee — now available for waste collection jobs too.
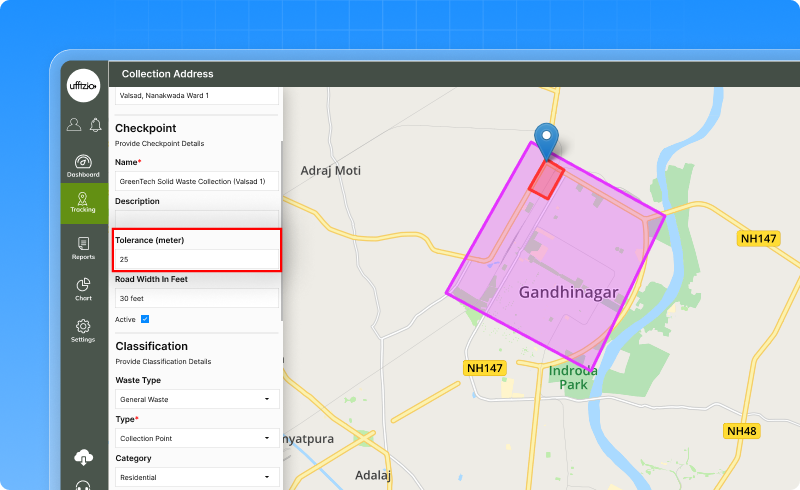
2.4 Adjust checkpoint radius in ongoing jobs
Earlier, once a job was created in SmartWaste, the checkpoint radius (used to detect visits) couldn’t be changed. This made it hard to adjust for real-world conditions in the field.
With this update, users can now:
- Edit the radius tolerance for checkpoints in valid jobs
- Make changes anytime if field conditions require a bigger or smaller range
- Apply the new radius automatically to future scheduled jobs
- Keep track of who made the change, when, and what was updated
This gives your clients more flexibility and control, without needing to recreate jobs from scratch when small adjustments are needed.
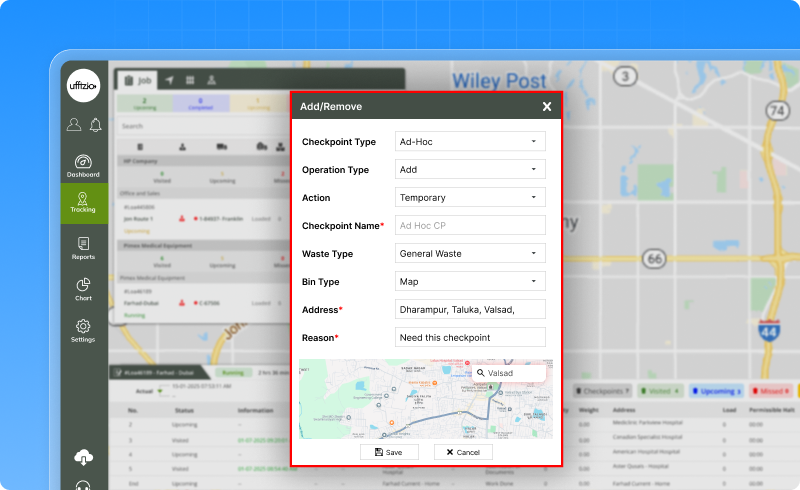
2.5 Add or remove bins during a job — in real time
Sometimes field conditions change. A truck reaches full capacity. A new bin needs to be picked up. Or a scheduled bin can’t be collected.
Until now, there was no easy way to update the job mid-route. That changes with this new feature.
From the live tracking screen, users can now:
- Add bins to an ongoing or upcoming job
- Remove bins if needed
- Choose if the change is just for today’s job or applies permanently to future jobs
Everything can be done directly from the Job Tooltip — no need to stop or reschedule. We’ve also introduced a new report: Job Checkpoint Modification Report, which logs:
- What was added or removed
- Who made the change
- Whether it was temporary or permanent
- The reason and exact time
This update gives your clients real-time flexibility while keeping full control and traceability of every bin change.
2.6 Connect citizens to nagar palika via social media
We’ve made it easier for citizens to stay connected with their local nagar palika. The citizen app now includes a new section — “Connect with Us” — where users can tap on social media icons to visit the nagar palika’s official social media pages. These buttons are customized at the town level, so each local authority can choose which platforms they want to link.
Citizens can now:
- Stay updated on local waste initiatives
- Share feedback or concerns
- Be part of community conversations
![]()
It’s a simple way to build trust, improve communication, and support better engagement — all from within the app.